Monday, December 12, 2016

Pivot Tables


In the previous lesson we cleaned up the data we’ve been collecting. Now the question is: what can we do with it? Look at this table. It was created from the over 65,000 rows of data in the movie rating dataset we saw a few lessons ago….

WomenMen
NumberAvg. RatingNumberAvg Rating
All Movies16,7163.5448,8193.53
Star Wars1024.232844.37
Abyss, The204.00823.55

How long do you think it would take you to calculate the values in this table from the raw dataset of ~65,000 rows? Justify your answer.

Wednesday, November 30, 2016

Why make visualizations?


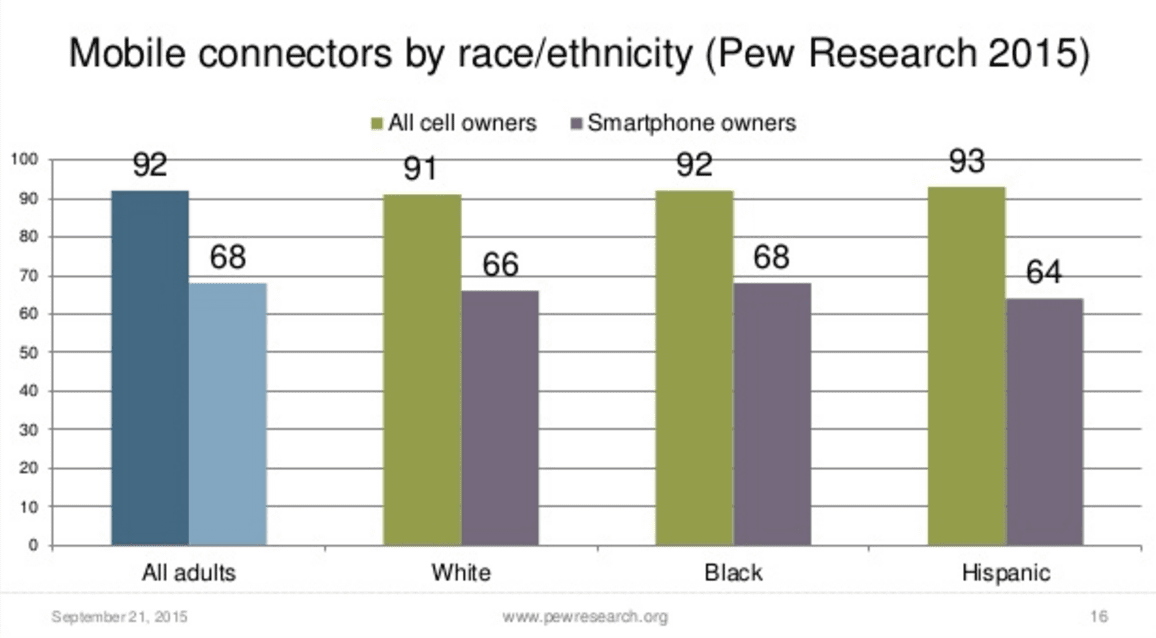
Yesterday you looked at a bunch of data from the Pew Research Center that was all presented visually in graphs and charts. The question is: why? Why did they choose to make a bunch of charts and graphs rather than just showing the raw data itself?

  • “Why did Pew Research choose to make a bunch of charts and graphs rather than just showing the raw data itself?
  • “List a few advantages and disadvantages (at least 2 for each) of using visualizations to communicate data”

Monday, November 28, 2016

Trends

Last week we started to collect data about ourselves so that we could learn about trends and patterns in our behavior. What is meant by the term "trending"?

Tuesday, November 22, 2016

Data Collection

Data is all around us. What are some examples of data and give a couple specific reasons as to why someone would collect data.

Monday, November 21, 2016

Intro to Data


The last project you did (Encoding an Experience) was about organizing and structuring digital data to represent complex information. You did it by thinking about bits. In reality we typically don’t have to break digital data down all the way to bits in order to work with it, but understanding that digital data at its root is just bits gives you insights into working with larger data sets. We are about to embark on a new series of lessons where you will work with real data sets and learn how to use to tools to explore and extract information and knowledge from the data. 

But before we do that, what exactly is data? Explain in your own words.

Wednesday, November 16, 2016

Encode an Experience.


We have come to the end of another unit where we have been building layers of encodings on top of the foundation of bits.


First we learned to develop binary numbers, then ASCII text, then formatted text, and finally color images. High-level encodings are actually quite removed from the underlying bits from which they are made.

What does it mean to encode something?

When we use the term abstraction, what are we referring to?